Phasing Out Fluorescence: Quantifying Mitosis Label-free
- Abstract number
- 2
- Presentation Form
- Poster
- DOI
- 10.22443/rms.elmi2021.2
- Corresponding Email
- [email protected]
- Session
- Poster Session 1
- Authors
- Meetal Solanki (1), Rebecca Charlton (1), Karen Hogg (2)
- Affiliations
-
1. Phasefocus
2. University of York
- Keywords
Mitosis
Cell-cycle
Cancer
Label-free
Quantitative Phase Imaging
- Abstract text
Mitosis is a crucial biological process that takes place in all eukaryotic cells and involves the equal segregation and division of a parent cell into two genetically identical daughter cells. This is distinguished by a highly regulated reorganization of cell components [1]. Changes to the cell cycle, e.g. in senescence, where there is irreversible arrest of cell proliferation, has been shown to lead to aging and age-related disease [2]. By contrast, uncontrollable cell division is a hallmark of cancer and is characterized by abnormal mitosis. Subsequently, several mitotic inhibitors have been used successfully as anti-cancer drugs [3].
The fungal toxin, cytochalasin D is used as a cytotoxic agent in cancer therapy as it disrupts actin polymerization and activates p53 independent pathways, causing arrest of the cell cycle at the G1-S phase transition. Nocodazole, another anti-cancer drug, works by impeding the formation of the mitotic spindle and cytokinesis. This arrests cells at a slightly different part of the cell cycle, blocking cells in mitosis [7]. Both these effects can result in inhibition of cellular processes such as cell division [4,5].
Current methods that exist to measure mitosis usually rely on the use of fluorescence markers, and relatively high light levels, which can ultimately perturb the natural function of cells [6]. Therefore, there is a need for a label-free technique that can reliably identify mitotic cells. Ptychography, a quantitative phase imaging (QPI) technique, produces high contrast images without the need for fluorescent labels. The consistent and enhanced contrast enables automatic segmentation and tracking of individual cells, as well as a quantitative measure of the single-cell phenotypic behaviour of whole populations. In this study we used a Livecyte system [8] to identify label free, unique phase signatures that indicate when a single cell is undergoing mitosis. A mitotic event is clearly distinguishable as the cell adopts a more spherical morphology with a greater optical thickness than resting cells.
The aim of this study was to measure and contrast the changes in mitosis between different concentrations of cytochalasin D and nocodazole as compared to untreated cells. MBA-MB-231 cells Hela cells were seeded at 1600 cells per well and allowed to adhere for approximately 24 hours. They were then preincubated with a range of concentrations of cytochalasin D and nocodazole before imaging.
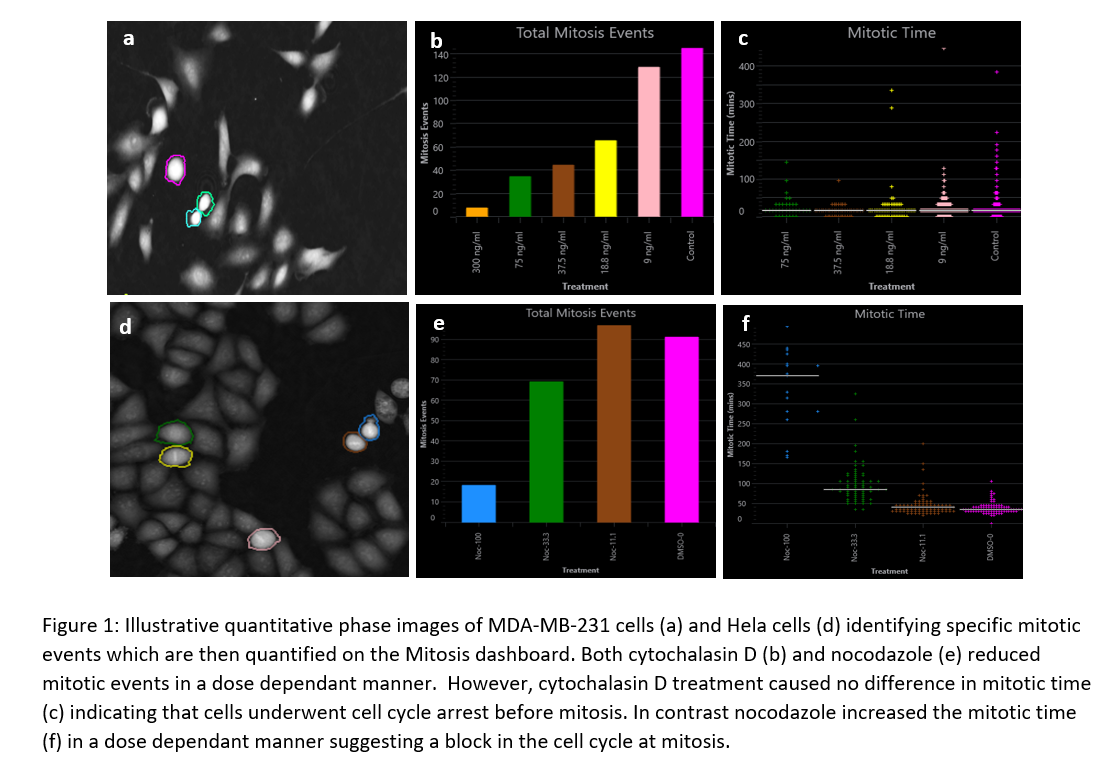
Using Livecyte’s label-free QPI mode and in-built Analyse software, metrics derived from the Mitosis Dashboard were compared for the different conditions. It revealed a dose dependent decrease in the number of mitotic events and thus proliferation in both cytochalasin D and nocodazole. It was also possible to distinguish where in the cell cycle these cells may have been arrested, notably through mitotic time values. Cytochalasin D treatment caused no difference in mitotic time indicating that cells underwent cell cycle arrest before mitosis. In contrast nocodazole increased the mitotic time in a dose dependent manner suggesting a block in the cell cycle at mitosis.
These observations were in line with those reported in the literature and reinforced the known mechanisms of both drugs giving more in depth information on the precise mechanism of action between these two cell cycle inhibitors.
- References
1. Ferreira, L.T., Figueiredo, A.C., Orr, B., Lopes, D. and Maiato, H., 2018. Dissecting the role of the tubulin code in mitosis. Methods in cell biology, 144, pp.33-74.
2. Childs, B.G., Durik, M., Baker, D.J. and Van Deursen, J.M., 2015. Cellular senescence in aging and age-related disease: from mechanisms to therapy. Nature medicine, 21(12), pp.1424-1435.
3. H. Schatten, 2013. Mitosis. Brenner's Encyclopedia of Genetics (Second Edition), pp.448-451
4. Trendowski M., 2015. Using cytochalasins to improve current chemotherapeutics. Anticancer Agents Med Chem., 15(3). pp 327-33.
5. Rubtsova S.N. et al., 1998. Disruption of actin microfilaments by cytochalasin D leads to activation of p53. FEBS Lett., 430(3). pp 353-7.
6. Sivakumar, S., Daum, J.R. and Gorbsky, G.J., 2014. Live-cell fluorescence imaging for phenotypic analysis of mitosis. In Cell Cycle Control (pp. 549-562). Humana Press, New York, NY.
7. Kuhn, M., 1998. The microtubule depolymerizing drugs nocodazole and colchicine inhibit the uptake of Listeria monocytogenes by P388D1 macrophages. FEMS microbiology letters, 160(1), pp.87-90.
8. Livecyte Kinetic Cytometer, from Phasefocus, UK