JIPipe: Designing automated image analysis pipelines without programming
- Abstract number
- 14
- Presentation Form
- Poster
- Corresponding Email
- [email protected]
- Session
- Poster Session 2
- Authors
- Ruman Gerst (1, 2), Zoltán Cseresnyés (1), Marc Thilo Figge (1, 2)
- Affiliations
-
1. Applied Systems Biology, Leibniz Institute for Natural Product Research and Infection Biology – Hans-Knöll-Institute, Jena, Germany.
2. Faculty of Biological Sciences, Friedrich-Schiller-University Jena, Germany
- Keywords
Automated image analysis
ImageJ
Visual programming
- Abstract text
JIPipe is a powerful visual programming language that provides an intuitive way to create batch processing pipelines in ImageJ1 via an easy-to-use graphical interface that suitable for beginners and advanced users.
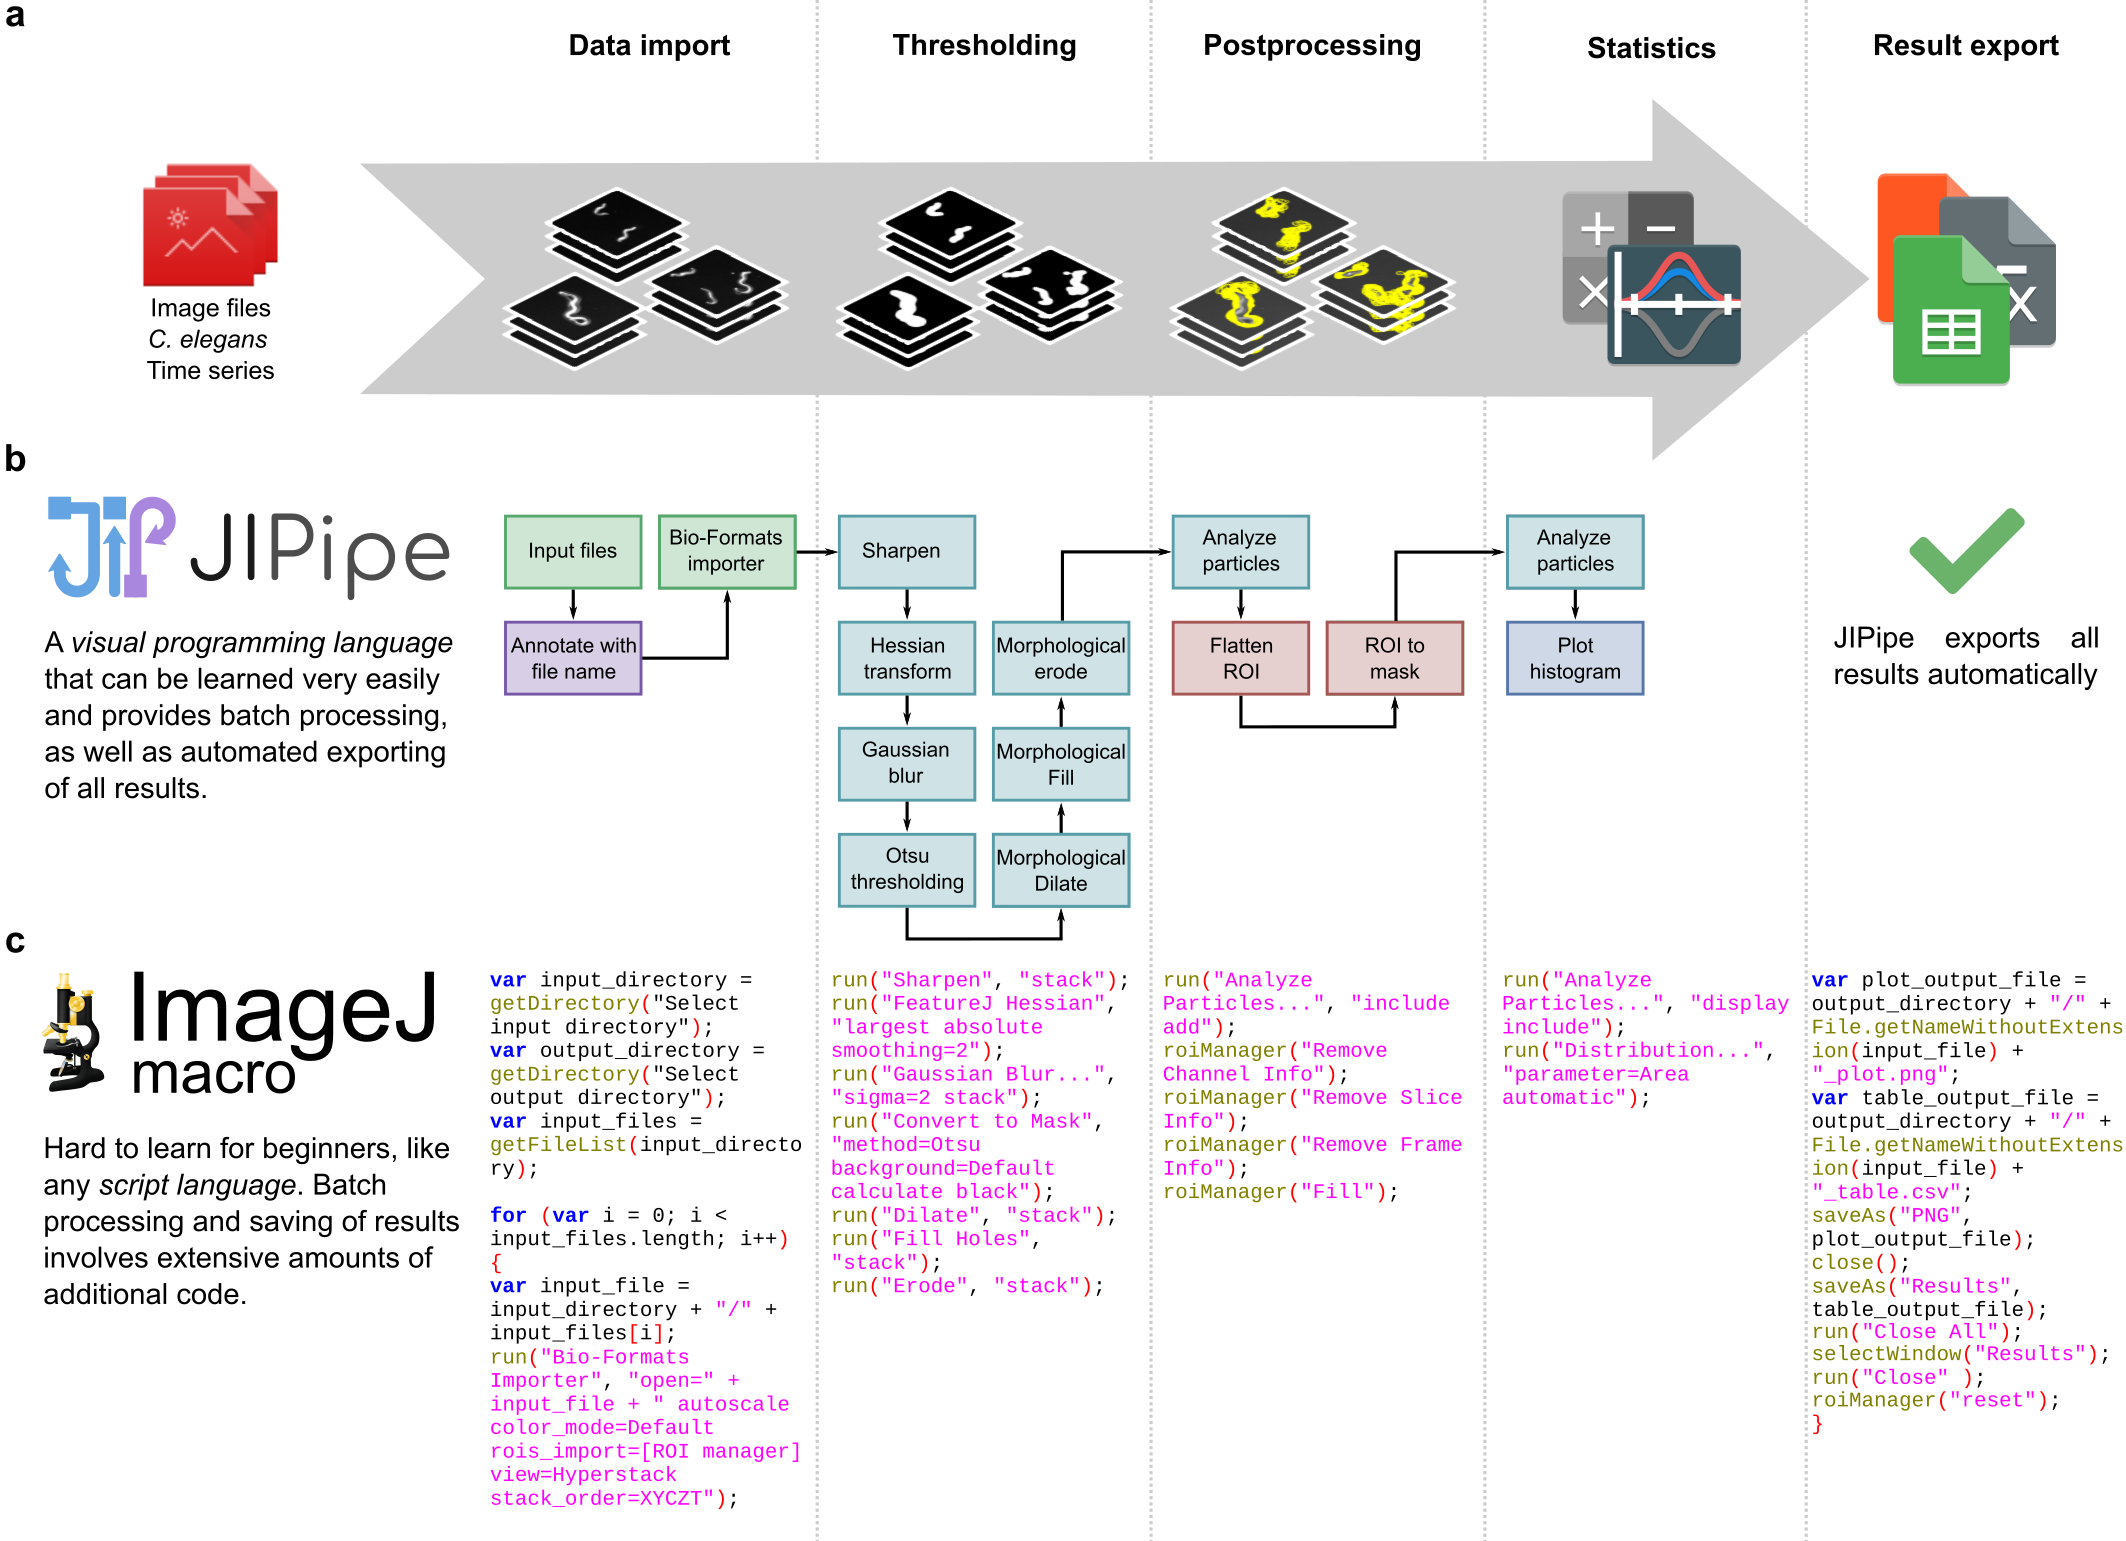
Figure 1: JIPipe makes the development of image analysis pipelines intuitive and easy to follow. (a) The general workflow to analyze data like such a set of C. elegans time series images with the purpose to extract the maximum covered area per worm. The process involves importing the data, applying thresholding and postprocessing, generating statistics, and finally storing the results on the hard drive. (b) A visual program designed in JIPipe that analyzes all images and automatically exports all results. (c) An ImageJ macro that applies an analysis equivalent to (b).
Modern microscopy technologies allow the visualization and quantification of a very wide range of biological systems and processes. Examples include host-pathogen interactions2,3, drug uptake by hepatocytes4, or the impact of diseases on kidney tissue5,6. The analysis of such images may involve hierarchies of hundreds of images and metadata files, making it hard to obtain statistics via manual inspection. Tools like ImageJ simplify the analysis considerably by providing a user-friendly graphical interface to commonly utilized image processing functions, such as extracting regions of interest, tracking algorithms, and automated evaluation of statistics. The user-friendliness of ImageJ is subject to a severe limitation: upscaling a single-data pipeline into an automated batch processing workflow of many images and image folder hierarchies is currently only possible by programming in a scripting language.
Here we present the Java Image Processing Pipeline (JIPipe), which provides a visual image processing language for ImageJ (see Figure 1). Visual programming languages are based on alternative concepts to scripting languages in that they represent programs as intuitive flowcharts with all technical details handled in the background. JIPipe is provided as a plugin that can be added to any existing ImageJ installation. Our tool comes pre-packaged with an extendible set of over 500 functions from ImageJ and popular plugins like Bio-Formats2, CLIJ27, MorphoLibJ8, and OMERO9. Each of these functions can be freely arranged and connected to each other in a flow chart to create linear or branching pipelines. Data and metadata are combined into tables, which allows easy up- and downscaling of pipelines by merely changing the set of input files. Additionally, users have access to features like integrated documentation and tutorials, automated saving of all results in a reproducible format, real-time preview of changes in parameters, easy organization of larger pipelines into functional units, customization of algorithms via mathematical expressions, and integration of existing ImageJ macros and scripting languages including R10 and Python (https://www.python.org/).
These features make JIPipe a powerful tool for beginners and advanced users to intuitively design image analysis pipelines. We will demonstrate this by presenting the whole process of designing such pipelines on example images from concrete biological applications.
- References
1. Rueden, C. T. et al. ImageJ2: ImageJ for the next generation of scientific image data. BMC Bioinformatics 18, 529 (2017).
2. Linkert, M. et al. Metadata matters: access to image data in the real world. J. Cell Biol. 189, 777–782 (2010).
3. Cseresnyes, Z., Hassan, M. I. A., Dahse, H.-M., Voigt, K. & Figge, M. T. Quantitative Impact of Cell Membrane Fluorescence Labeling on Phagocytosis Measurements in Confrontation Assays. Front. Microbiol. 11, 1193 (2020).
4. Adrian Press, A. T. et al. Targeted delivery of a phosphoinositide 3-kinase γ inhibitor to restore organ function in sepsis through dye-functionalized lipid nanocarriers. bioRxiv 2021.01.20.427305 (2021) doi:10.1101/2021.01.20.427305.
5. Klingberg, A. et al. Fully automated evaluation of total glomerular number and capillary tuft size in nephritic kidneys using lightsheet microscopy. J. Am. Soc. Nephrol. 28, 452–459 (2017).
6. Dennhardt, S. et al. Modeling hemolytic-uremic syndrome: In-depth characterization of distinct murine models reflecting different features of human disease. Front. Immunol. 9, (2018).
7. Haase, R. et al. CLIJ: GPU-accelerated image processing for everyone. Nat. Methods 17, 5–6 (2020).
8. Legland, D., Arganda-Carreras, I. & Andrey, P. MorphoLibJ: Integrated library and plugins for mathematical morphology with ImageJ. Bioinformatics 32, 3532–3534 (2016).
9. Allan, C. et al. OMERO: flexible, model-driven data management for experimental biology. Nat. Methods 9, 245–253 (2012).
10. R Core Team. R: A Language and Environment for Statistical Computing. (2017).